
The US has announced the reciprocal tariffs that come in addition to the existing ones.
| Moratorium rate till July 2025 as per announcement of April 9th (“Reflection Day”) | Possible rate after moratorium as announced April 2nd (“Liberation Day”) | |
| EU | 10 % | 20 % |
| North Macedonia | 10 % | 33 % |
| Albania | 10 % | 10 % |
| Bosnia and Herzegovina | 10 % | 36 % |
| Kosovo | 10 % | 10 % |
| Montenegro | 10 % | 10 % |
| Serbia | 10 % | 38 % |
For Serbia, there are pictures of a table showing 37 % 10 % is the rate imposed to all countries. Source: Whitehouse.gov
These rates do not apply if there are special rates, eg. on vehicles, steel etc.
The tariffs have been calculated according to a formula “Trade deficit with country” / “US imports from country”, with a minimum tariff for all countries.
But what are the trade data?
The data varies depending which country views the imports and exports and what method is used. In the case of North Macedonia, there are huge differences.
The OEC view
The Observatory of Economic Complexity (OEC) offers detailed global trade data, covering over 500 subnational regions, 5,000 products, and thousands of firms. OEC is a spun out of MIT.

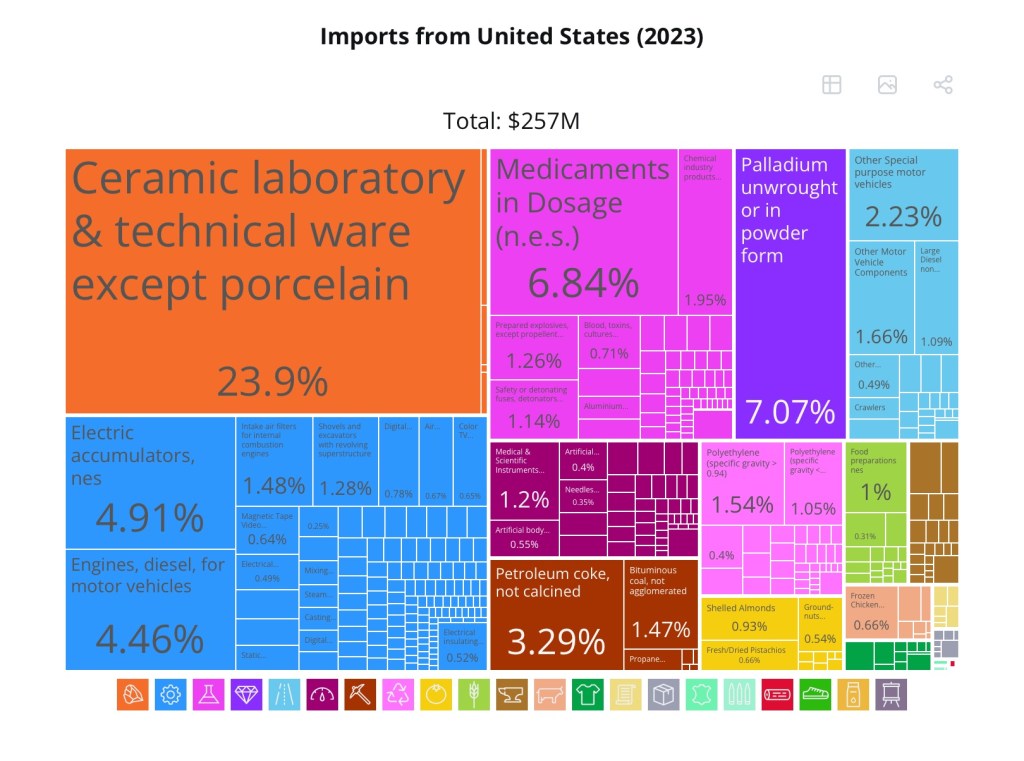
| US$ mio | 2022 | 2023 |
| Export to US | 193 | 273 |
| Import from US | 180 | 257 |
| US Deficit | -13 | -16 |
| Deficit / US exports | -7 % | -6 % |
North Macedonia does not have a large trade volume with the US, but there is a slight deficit according to OEC.world
The Macedonian view – by MakStat, the Macedonian State Statistical Office
According to MakStat, the trade development between North Macedonia and the US was
| US$ mio | 2022 | 2023 | 2024 | Jan. 2025 |
| Export to US | 85,9 | 53,7 | 118,2 | 21,8 |
| Import from US | 183,9 | 267,1 | 195,9 | 12,4 |
| US Deficit | 98,0 | 213,5 | 77,7 | -9,4 |
| Deficit / US exports | +53 % | +80 % | +40 % | -76 % |
The US view, by the US Census office
According to Census.gov, the numbers are
| US$ mio | 2022 | 2023 | 2024 | Jan. 2025 |
| Export to US | 227,7 | 286,9 | 173,7 | 20,0 |
| Import from US | 48,7 | 58,1 | 60,6 | 6,0 |
| US Deficit | -178,3 | -228,7 | -113,1 | -14,1 |
| Deficit / US exports | -366 % | -394 % | -187 % | -235 % |
Why are there differences, and where do they come from?
The differences MKD > US are likely to be buses – the biggest export good with about 200 mio US$ value – which are not counted as exports to the US, but to the buyer who later sells them to the US.
For US > MKD (and similar to other countries) the reason is probably „diversions“: an exporter ships goods (electronic appliances, vehicles, food items) to a central storage location close to a port. US statistics count this as export to the location of this storage: Netherlands, Italy, Greece. The specific import is done from the storage, MKD customs count from the country of origin, the US.
Other differences might be because of timing, goods counted when crossing the border when leaving the country and on custom processing – maybe after storage in a customs warehouse – by the importing country. This creates “floating inventory” between the export and the import date.
Other differences can come from refinement of products, eg. changing from large packaging (eg. container) to smaller (eg. pallet origen) increasing the price by the cost of handling. The export value does not contain the transportation cost after the export country border, the import value does include the transportation cost after value before the import country border. This concerns overseas shipping cost, but also trucking through third countries or interim storage.

Leave a comment